7/17/2026
Ad MeasurementMERD2C

There is no single good MER for Indian fashion D2C: the honest benchmark is your own break-even Retained MER, which depends on your COD share, your category return rate, and your margin structure. This page gives the framework to compute it, and the reasons any universal number misleads.
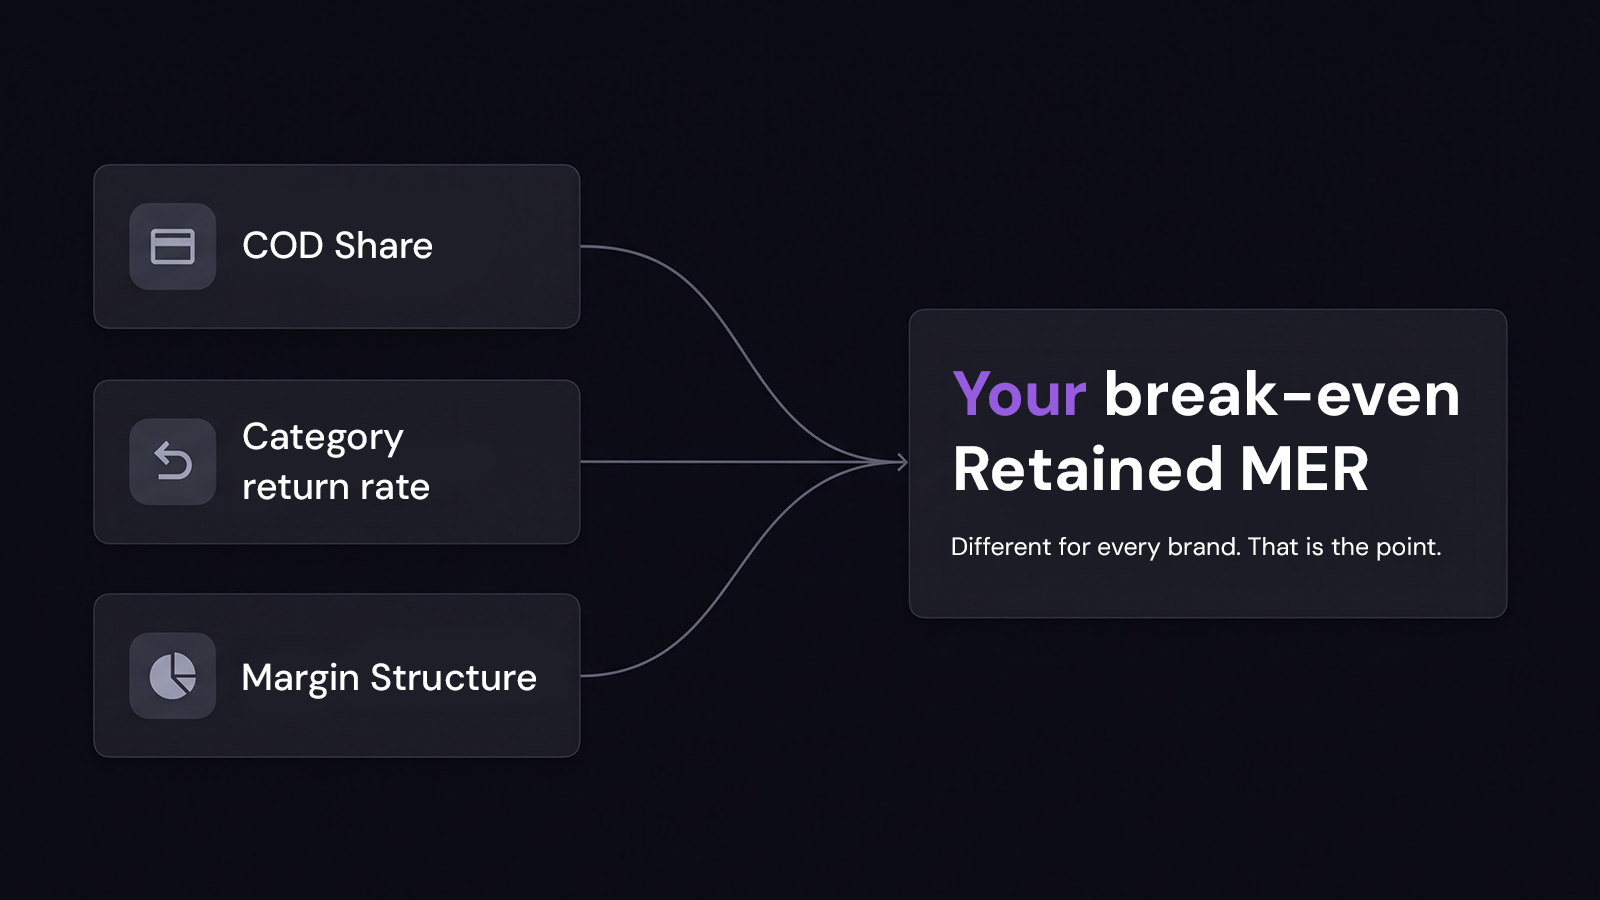
Three brand-specific inputs set your break-even Retained MER: COD share, category return rate, and margin structure. Blend them into one industry average and you get a number that fits nobody.
Three things decide your break-even, and none of them are the same from one brand to the next. Your COD share, cash on delivery still makes up the majority of orders for a lot of Indian D2C brands, and fashion tends to run higher on this than most categories, though the exact split is yours to pull, not something a blog post can hand you. Your category return rate, fashion carries structurally high returns, size, fit, and expectation, not product defects, and that figure is still being verified with sourced data before it gets a specific number anywhere on this blog, we're building a dedicated piece on fashion's gap specifically, not live yet, so no number and no link to point you to today. And your margin structure, gross margin after product cost and shipping, which is entirely yours and nobody else's business to average into a benchmark.
Blend those three into one number and you get an industry average that fits nobody's actual account. It's the same Reality Gap logic behind everything else on this blog: what gets reported and what actually gets retained are different questions, and MER inherits that gap the same way ROAS does.
The formula isn't new, Retained MER already covers it: retained revenue divided by total marketing spend, same period. Your break-even is the specific Retained MER where contribution turns positive, given what you actually keep after cancellations, COD failures, and returns.
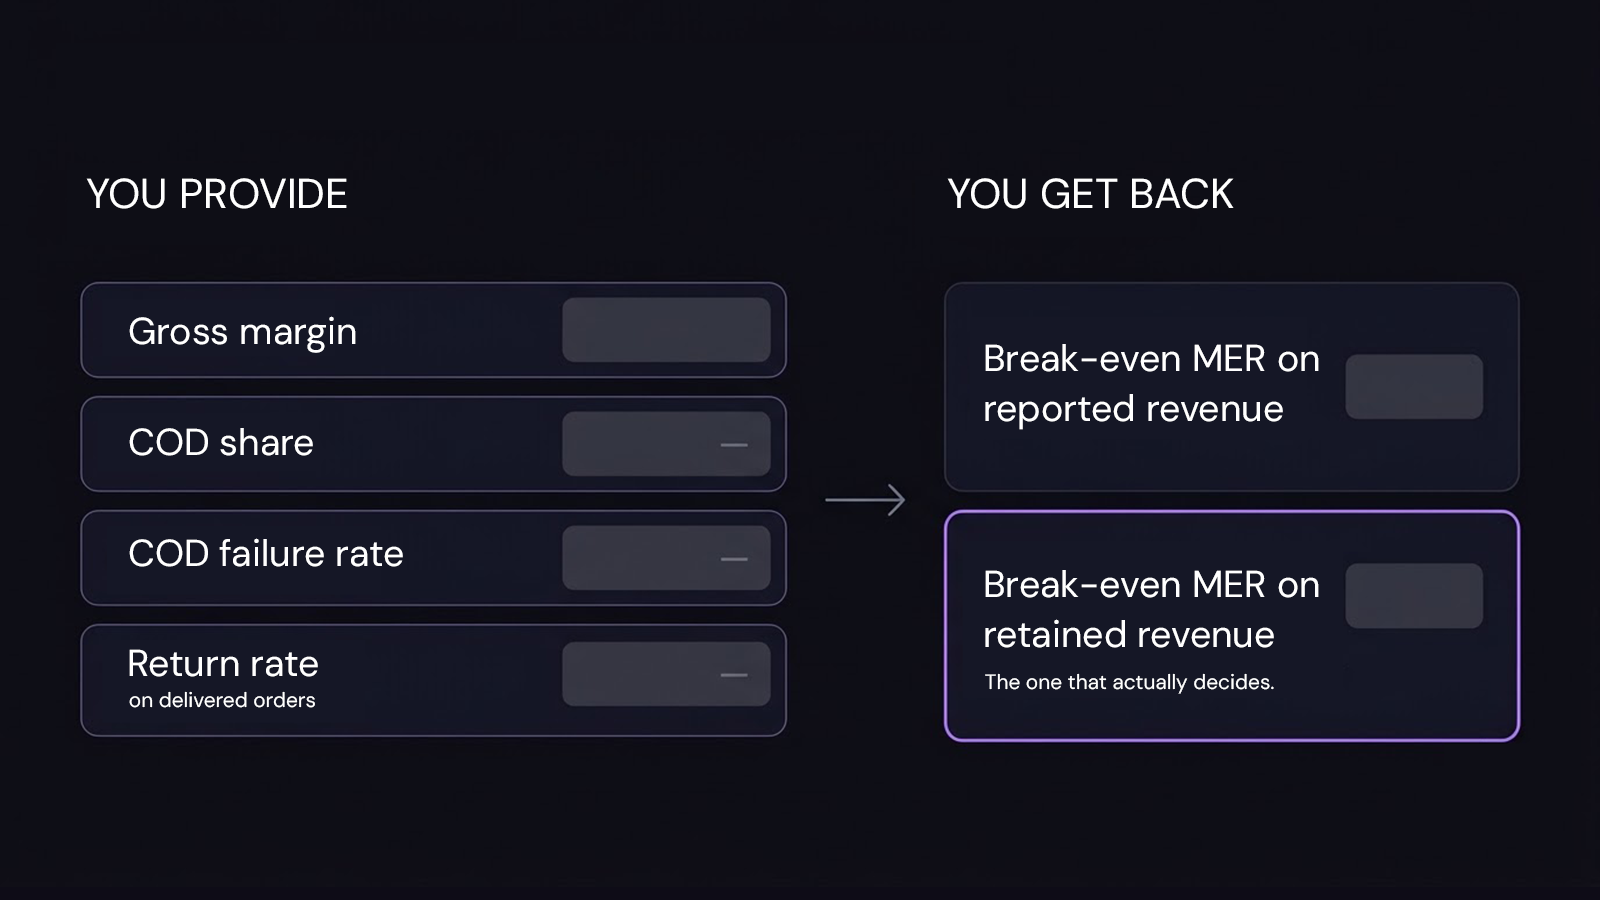
The calculator takes four numbers you already have, gross margin, COD share, COD failure rate, and return rate, and returns two: your break-even MER on reported revenue, and the tighter, more honest one on retained revenue.
Four numbers get you there: your gross margin, your COD share, your COD failure rate, and your return rate on delivered orders. Adverti's break-even MER calculator takes exactly those four and hands back two: the break-even MER on reported revenue, and the tighter, more honest one on retained revenue. That second number is the one that actually decides whether a campaign is working, not the first.
Search "good MER for D2C" and you'll find ranges, 3 to 5 is common, sometimes narrower. Worth asking where those numbers came from. Almost none of them name a source. The brands loud enough to publish a number are usually the ones doing well enough to want to, which skews the sample toward winners before you've even started comparing yourself against it. And nearly every published range is standard MER, gross reported revenue over spend, not retained. None of that makes the number fake exactly. It just means it isn't answering the question you're actually asking.
Anyone quoting one universal number is selling something. Not always maliciously, sometimes it's just an easier post to write than a framework. But a single number claiming to fit every Indian fashion D2C brand, at every COD share, every return rate, every margin, can't be honest and simple at the same time. Pick honesty.
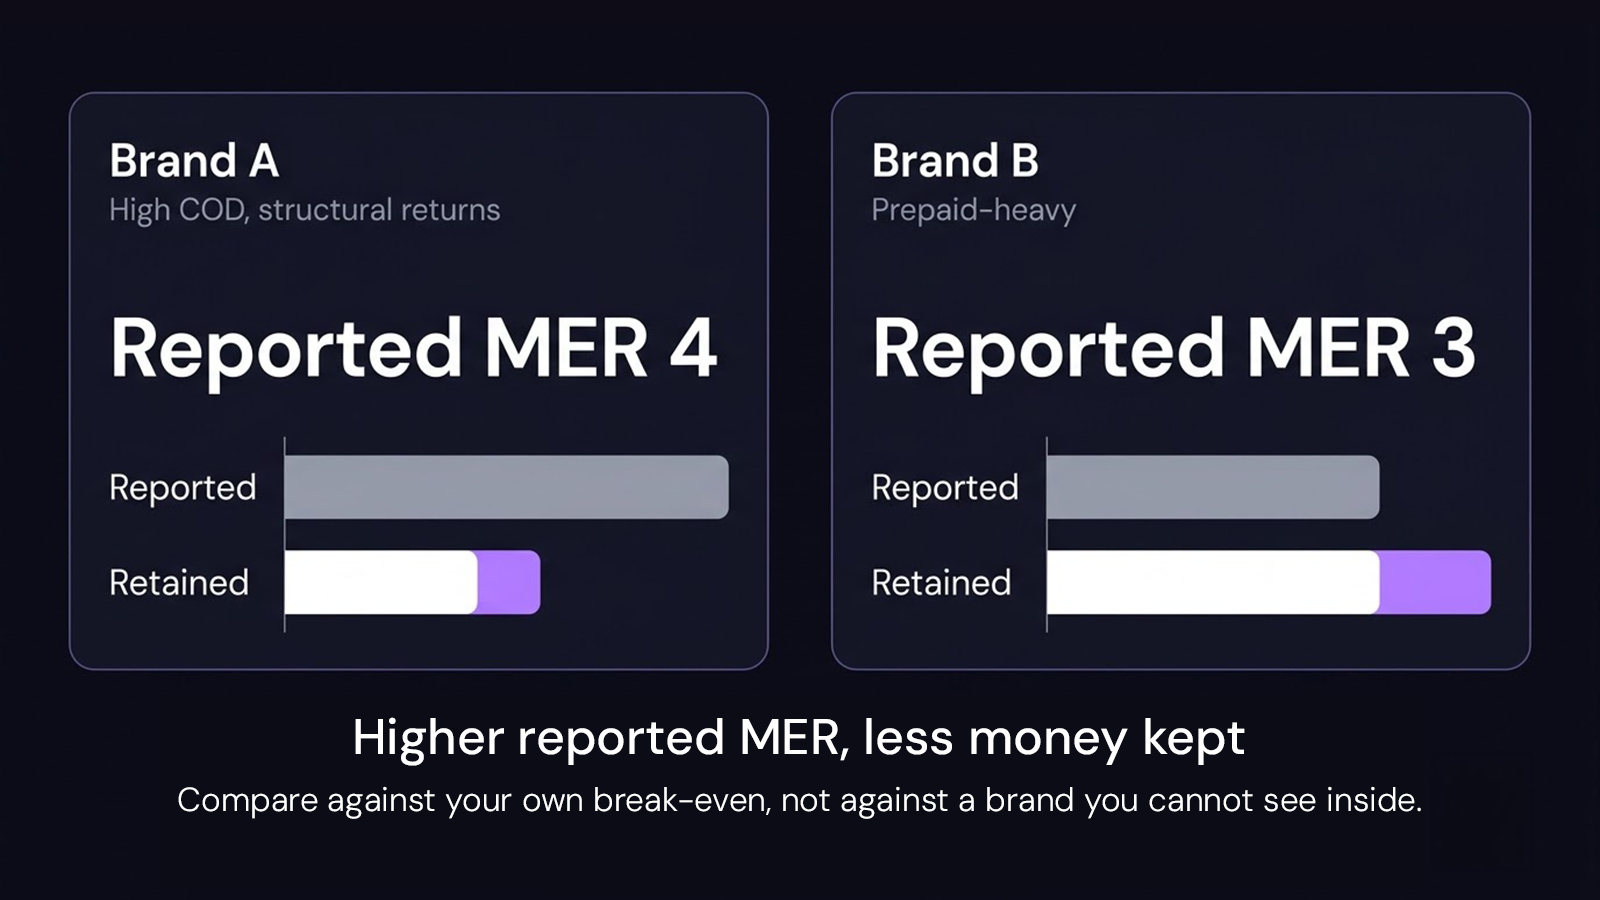
Same-ish reported MER, different money kept. Brand A reports a higher MER than Brand B but retains less, because of its COD and return exposure. Illustrative and directional, not to scale.
This page updates the moment that changes. If Adverti's own data across enough fashion D2C accounts, verified and signed off before it ships, ever supports a real first-party benchmark, it goes here, sourced, dated, and it replaces this framework-only version. Until a sample honestly supports that, the framework above is the actual answer. If you've already run the seven-number checklist, your own break-even Retained MER was item 5 there. This page is that same idea, worked through specifically for fashion.
Not answerable in general, and that is the point: at a high COD share and structural fashion returns, a standard MER of 4 can retain less than a prepaid brand's 3. Compute your break-even Retained MER, compare against yourself.
See your own estimated gap. Adverti Chat joins your ad spend with your store and delivery outcomes and shows a stitched estimate of what you actually kept, next to what was reported. Free plan, read-only access, no card.
Don’t miss our most popular and impactful reads.
Connect your Meta and Google accounts. Your first audit is ready in 30 seconds. Free forever on the Free plan.
We use cookies to keep Adverti working, understand how the site is used, and measure our ads. You can accept all, reject all, or choose what you allow. Read more in our Cookie Policy.