7/17/2026
Ad MeasurementMERD2C
COD affects ROAS by adding a failure mode after the conversion is counted: the majority of Indian D2C orders are cash on delivery, each carrying a doorstep veto the pixel cannot price. Two campaigns with identical reported ROAS can retain very different revenue purely on COD mix.
Here's the thing about a COD order: your ad platform counts it the second checkout completes. Same pixel fire, same conversion logged, same as a prepaid order. Except nothing has actually happened yet. The order is a promise, not a payment. Someone still has to open the door, look at the parcel, and decide they still want it.
That's the doorstep veto. Prepaid orders don't really carry one, the money already moved. COD orders carry it every time, and in India that's not some small slice of orders you can shrug off. The majority of D2C orders here still run on COD. It's not a minority payment method or an edge case, it's the norm for a lot of Indian D2C brands.
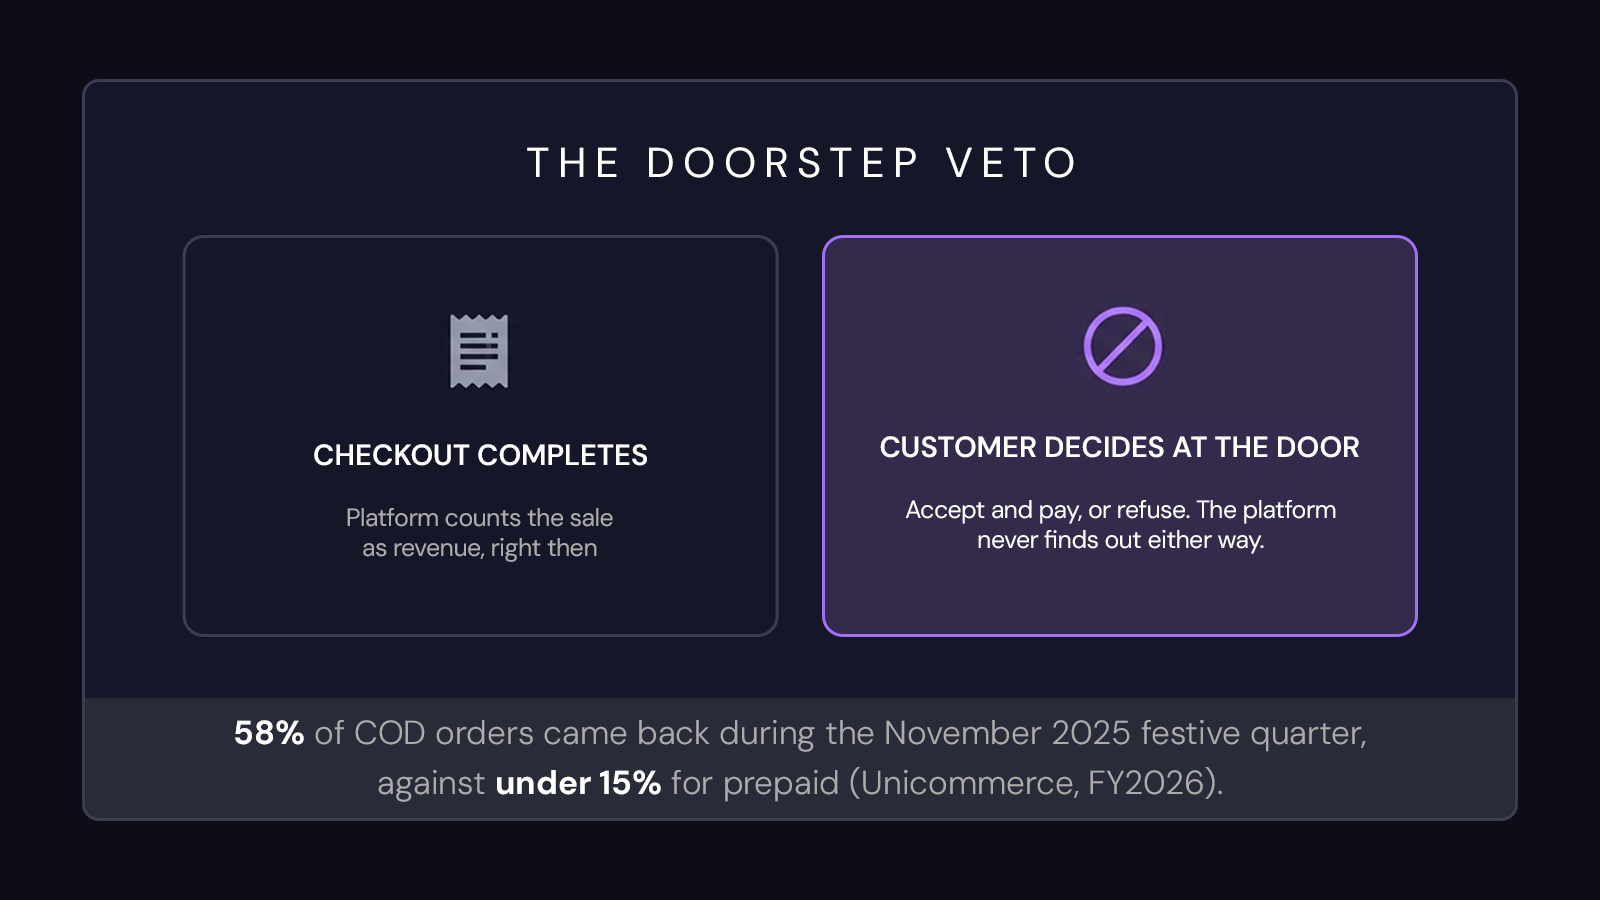
The sale gets counted before the customer decides to keep it.
And we already know how badly that veto gets used. During the November 2025 festive quarter, 58% of COD orders came back, against under 15% for prepaid (Unicommerce, FY2026). This is the same Reality Gap that keeps showing up on this blog. What the platform says happened and what your bank account says happened are two different stories, and COD is one of the biggest reasons they split.
Say two campaigns both report 3.5x ROAS this month. Same platform, same reporting logic, same pixel. On the dashboard they look like twins.
They're not. Say Campaign A is running mostly in COD-heavy pincodes, 70% COD share. Campaign B is mostly prepaid, 20% COD. Run both through the same default assumptions Adverti's true ROAS calculator uses, a 30% COD failure rate and a 12% return rate on delivered orders, and the twins stop looking alike:
Illustrative example using the calculator's own default assumptions, not a live account. Run your own COD share and failure rate to get your actual number.
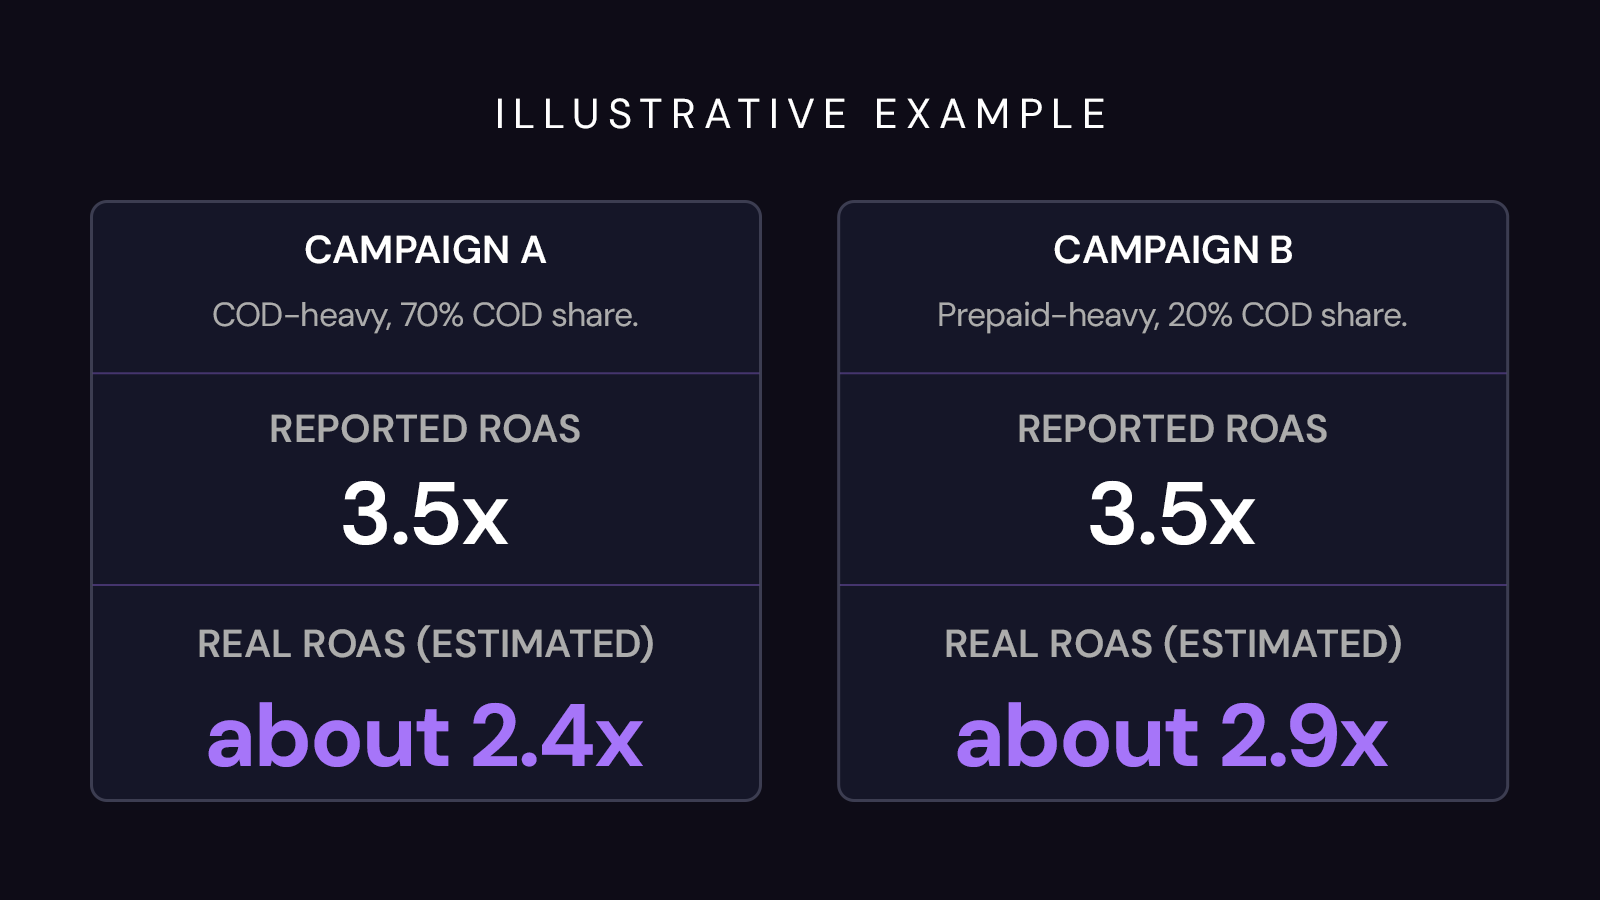
Illustrative example, not a live account. Same reported ROAS, a full turn apart once COD mix is priced in.
That's a full turn of ROAS apart, and the dashboard never shows it. If you're deciding which campaign to scale based on the top row alone, you'd probably pick wrong, or at least pick without knowing what you're trading off. Payment mix isn't a footnote here. It's a marketing metric, the same tier as CTR or CPM, because it changes what the same reported number is actually worth. Article 4 gets into why Meta reports higher ROAS than your actual revenue in more depth if you want the full mechanism, and the RTO budgeting piece covers the cost side of this same gap.
Most founders check ROAS at the account level, maybe the campaign level if something looks off. Almost nobody checks COD share at the campaign level, and that's exactly where this hides.
Here's what that looks like in practice. Say you're running five campaigns. Four are clean, mostly prepaid, reported and real ROAS sitting close together. One is your best-looking campaign on paper, high ROAS, scaling nicely, and it's also running almost entirely in COD-heavy Tier 2 and Tier 3 pincodes. That one campaign can carry most of your account's COD risk while looking like the account's star. Nobody notices until the RTO parcels start showing up three weeks later, and by then you've already scaled the budget on the strength of a number that was never going to hold.
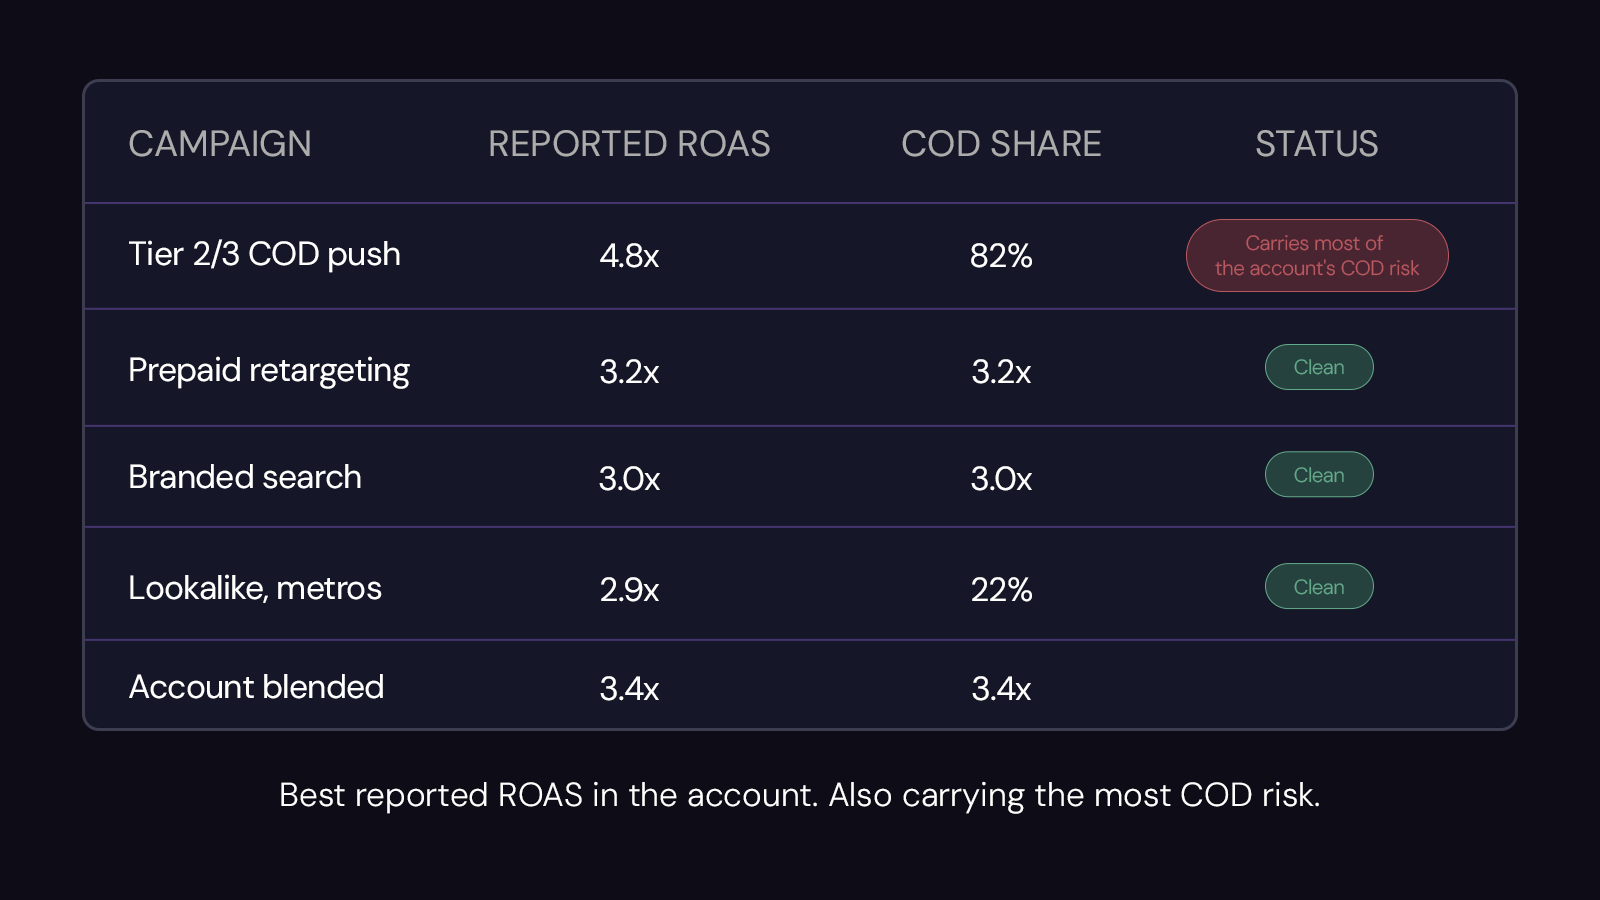
Illustrative example, not a live account. The best number on the dashboard and the riskiest campaign in the account can be the same campaign.
The fix isn't complicated. It's just a different first cut. Before you look at blended account ROAS, pull COD share per campaign. Wherever that number is high and reported ROAS is also high, that's the one to check with real numbers before you touch the budget, not after.
None of this means turn COD off. For a lot of Indian D2C brands, especially outside the metros, COD is still how a large share of customers are willing to buy at all, and killing it usually costs more in lost topline than it saves in avoided RTO. But there are levers that move the number, and it's worth being straight about what each one actually costs you.
A prepaid incentive at checkout, a small discount or a free-shipping nudge for paying upfront, is the one with the best evidence behind it. Unicommerce's own report shows this converting 20 to 30% of customers who started out as COD intenders. The trade-off is margin. You're paying for certainty.
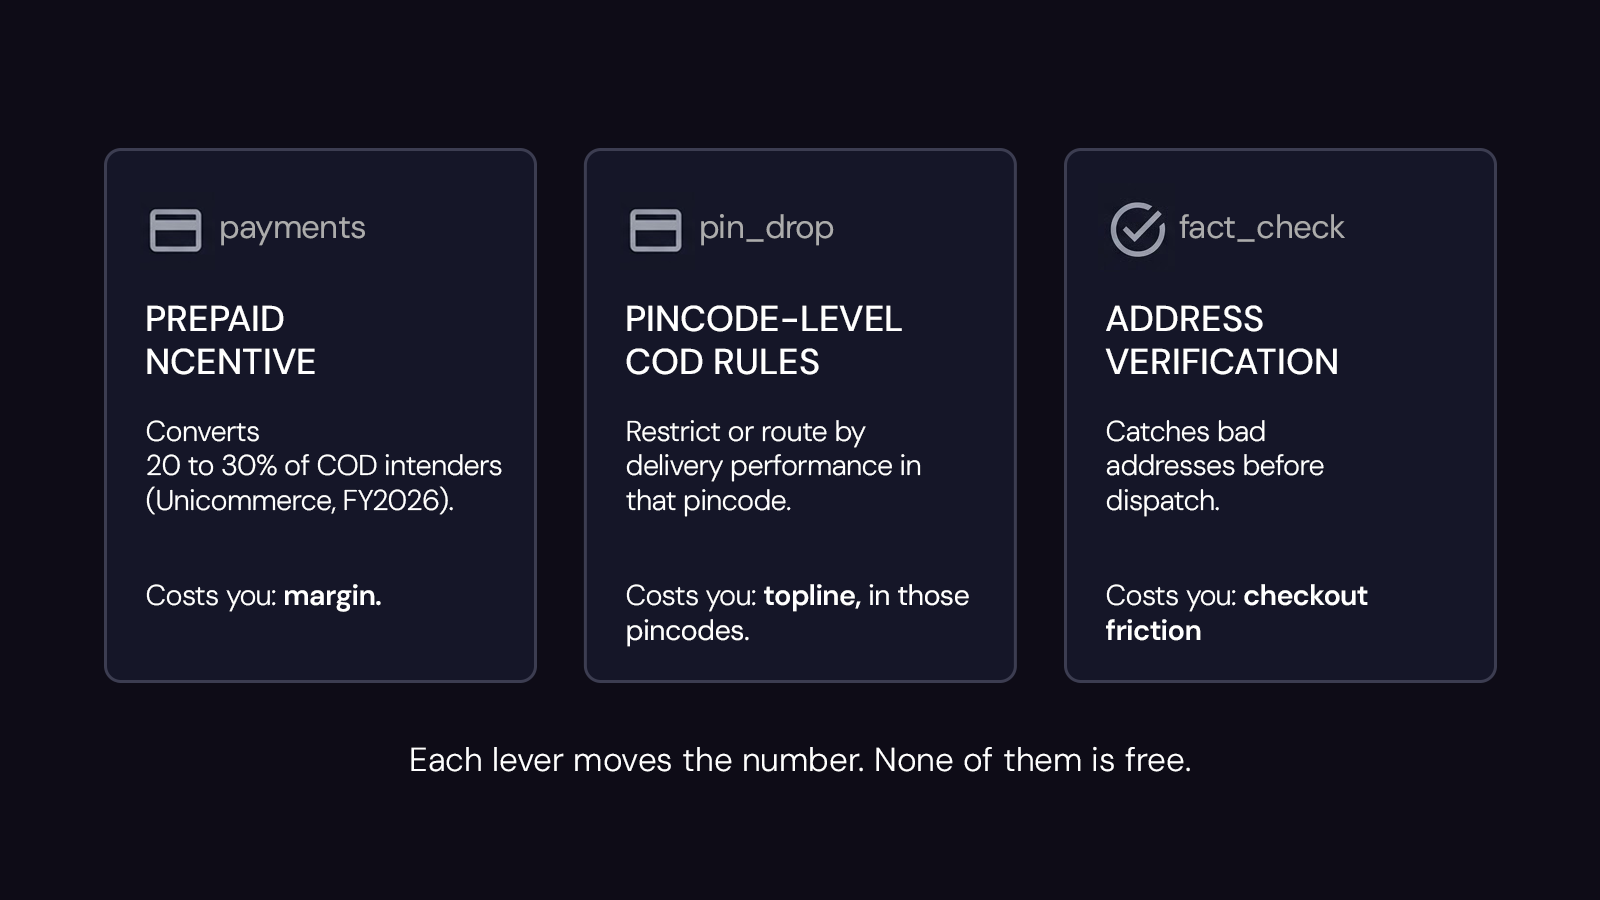
Pincode-level COD restriction, or courier routing based on actual delivery performance in that pincode, is more surgical. You're not touching COD everywhere, just where it's failing the most. The trade-off is topline in exactly those pincodes. Some of those customers won't switch to prepaid, they'll just leave.
Address verification before dispatch is the third lever, catching bad addresses before a courier gets sent out on a delivery that was never going to land. The trade-off is friction, one more step between order and dispatch that can cost you completions if it's clunky.
Unicommerce's report ties the RTO recovery we cited earlier, the swing from around 39% to around 21%, to this combination of levers. Worth reading the fuller breakdown on reducing RTO and COD failures if you want to go deeper on the logistics side specifically. None of this is about picking a vendor. It's what the data says moves the number, and what it costs you to move it.
One honest caveat before you take any of this into a budget meeting: COD mix isn't the only thing moving the gap between reported and real ROAS. Category matters just as much. Fashion and apparel carry high return rates for reasons that have nothing to do with payment method, size, fit, and colour looking different on screen than in hand. A prepaid fashion order can still come back.
This piece isolates COD as one variable because it's the one that's easiest to miss, not because it's the only one. If you're in a high-return category, you need both the COD correction and the category correction before a number is trustworthy enough to plan around.
Sometimes, and carefully: prepaid-heavy audiences often differ in age, city tier, and intent, so the comparison must hold the audience constant. The defensible first step is measuring retained revenue per campaign before redirecting spend.
See your own estimated gap. Adverti Chat joins your ad spend with your store and delivery outcomes and shows a stitched estimate of what you actually kept, next to what was reported. Free plan, read-only access, no card.
Don’t miss our most popular and impactful reads.
Connect your Meta and Google accounts. Your first audit is ready in 30 seconds. Free forever on the Free plan.
We use cookies to keep Adverti working, understand how the site is used, and measure our ads. You can accept all, reject all, or choose what you allow. Read more in our Cookie Policy.